GoDiagram Samples
Our samples demonstrate how to build several Diagram types and showcase specific features and layouts. You can use the code in these samples as the starting point for your application.
If you are done looking around and are ready to experiment with GoDiagram, read the getting started tutorial.
If you are looking for examples of a particular GoDiagram method or property, you can search the source code of all samples and extensions on GitHub:
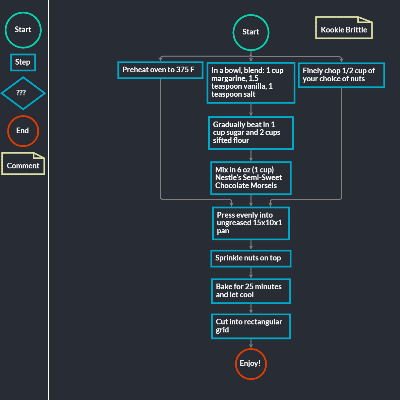
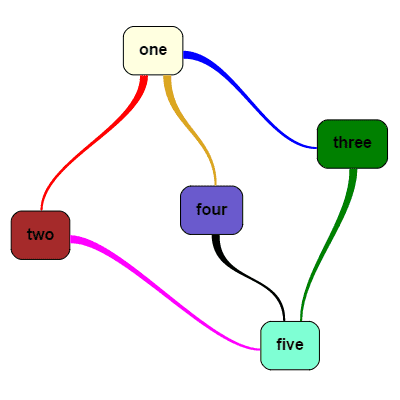
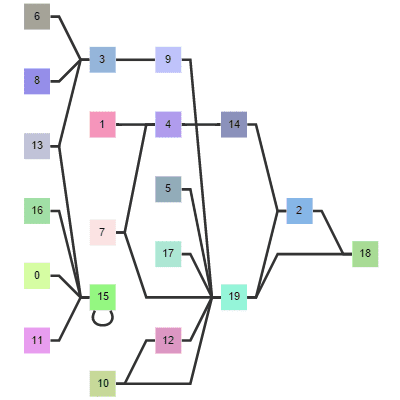
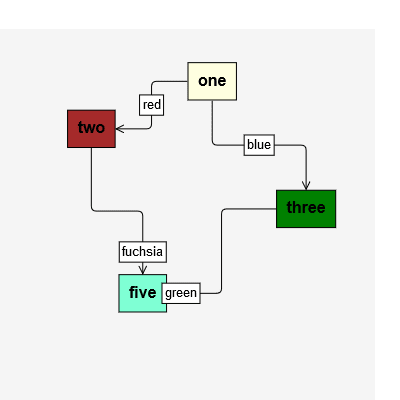
Flowchart
A standard flowchart, showing different node templates and several data bindings. Each node has 3 or 4 port elements. Links are orthogonal and avoid nodes.

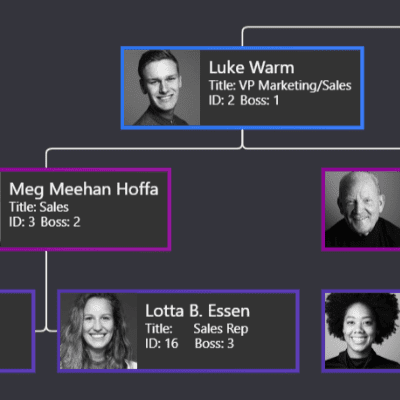
OrgChart (Static)
Shows an organizational chart, uses an in-laid Overview to aid the user in navigation, and allows the user to search by example.
OrgChart Editor
An organizational chart that allows user editing and re-organizing of the hierarchy.
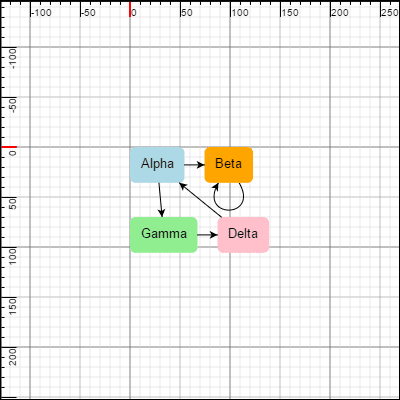
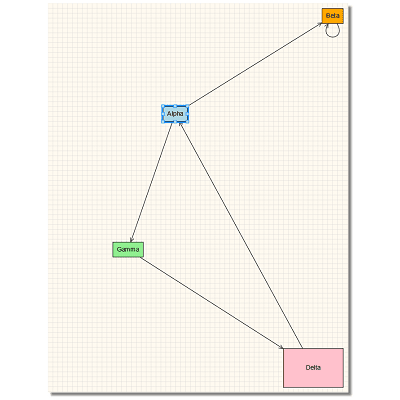
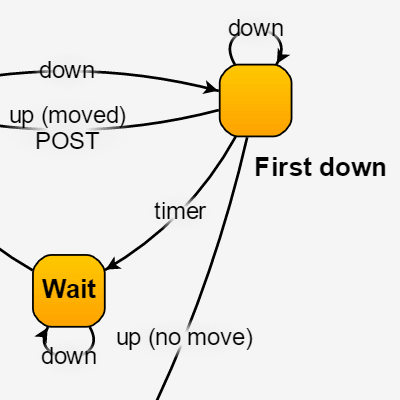
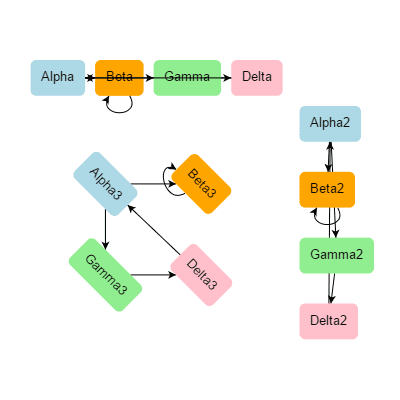
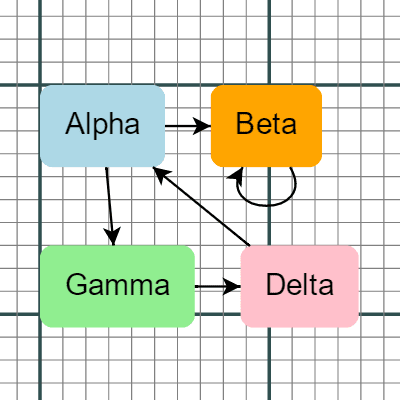
State Chart
A state chart diagram that also shows dynamic creation of new nodes and links on a button press.
Basic
Shows many of the commands possible in GoDiagram, templates for Links and for Groups, plus tooltips and context menus for Nodes, for Links, for Groups, and for the Diagram.
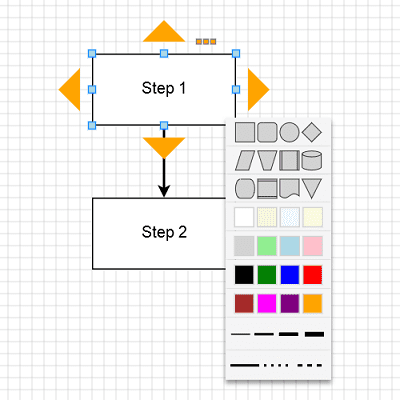
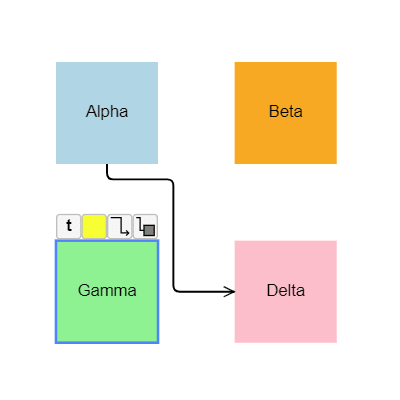
Block Diagram
A simple block diagram editor that makes it easy for the user to chain together new nodes, with context menus for changing shapes and colors.
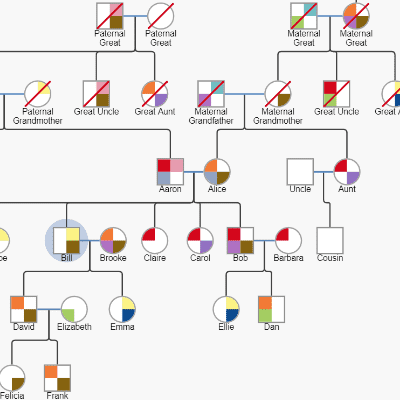
Genogram
A genogram or pedigree chart is an extended family tree diagram that show information about each person or each relationship.
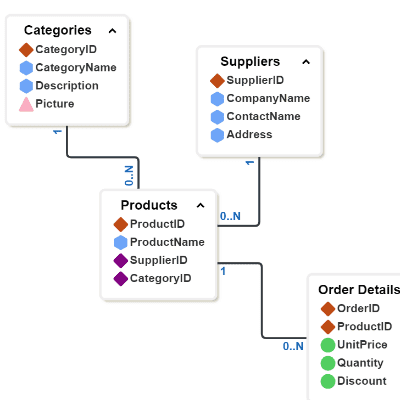
Entity Relationship
An entity relationship diagram, showcasing data binding with item lists.
SVG Icons
Create your own custom Shapes using SVG path strings. This sample uses SVG strings from a free icon set.
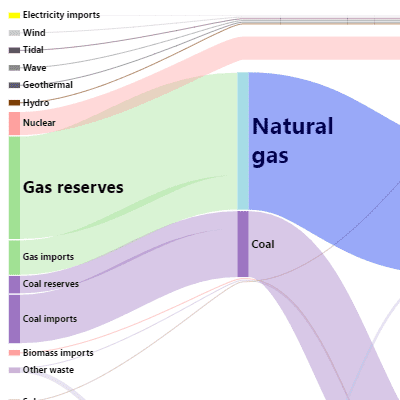
Sankey
Sankey diagrams show the amount of flow between nodes by the width of the links.
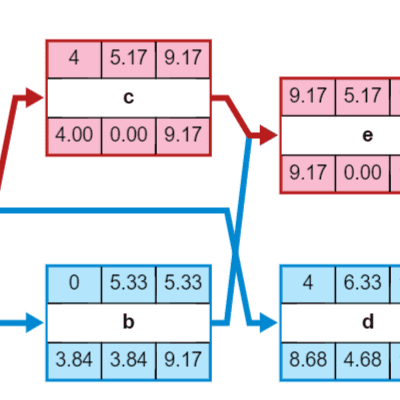
PERT
A simple PERT chart, showcasing GoDiagram table panels and RowColumnDefinition properties.
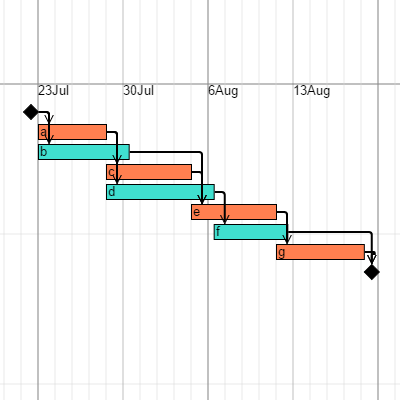
Gantt
Demonstrates a simple Gantt chart.
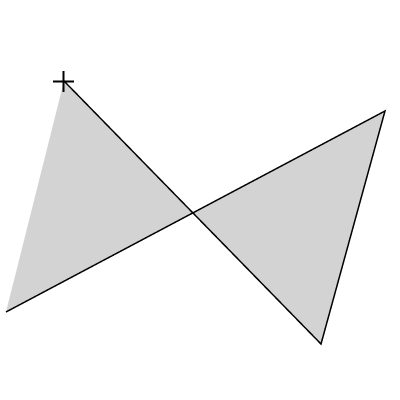
Euler Diagram
A read-only diagram where clicking on a node will open a new webpage.
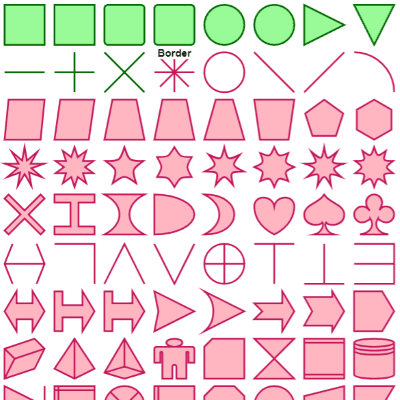
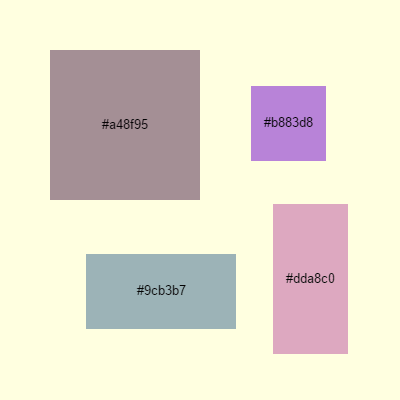
Shapes
Showcases all pre-defined GoDiagram figures. You can define your own named Shape figures.
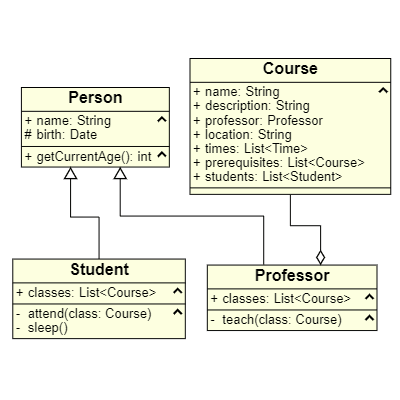
UML Class
A UML Class diagram shows software classes and their properties and methods, and the relationships between them.
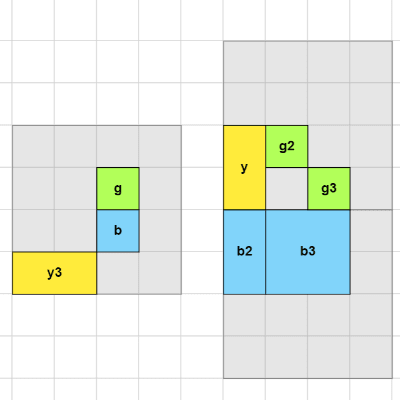
Planogram
Drag-and-drop items from the Palette onto racks in the Diagram.
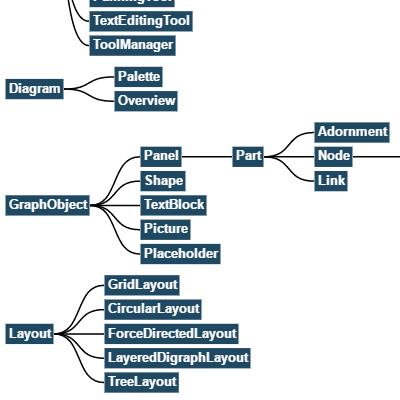
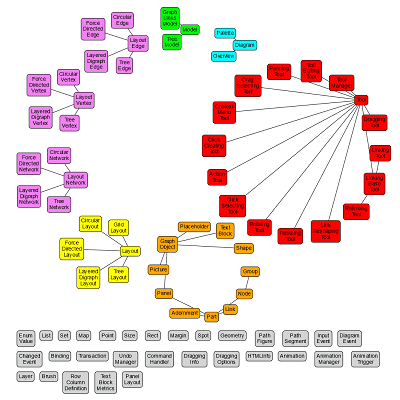
Class Hierarchy
Displays the GoDiagram Class Hierarchy as a series of trees. Double-click to go to the class's API documentation.
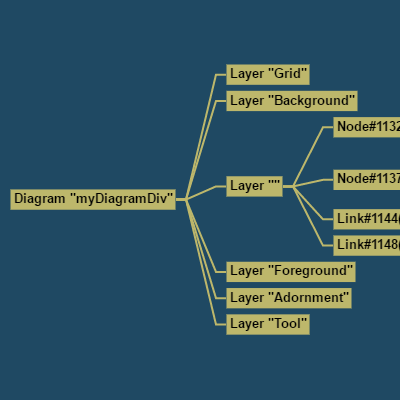
Visual Tree
This sample shows the actual visual tree of a running Diagram, using a second Diagram.
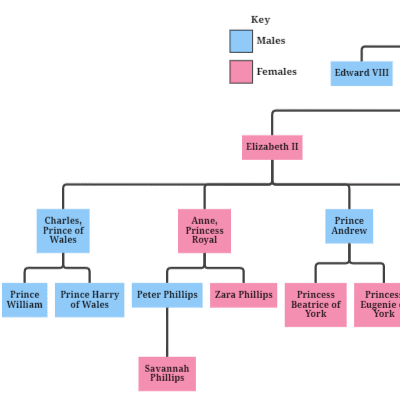
Family Tree
Shows a standard family tree.
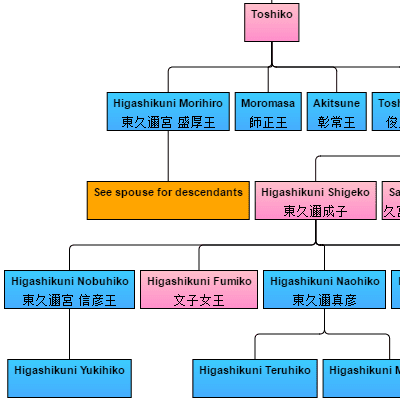
Family Tree (Japanese)
Shows a standard family tree.
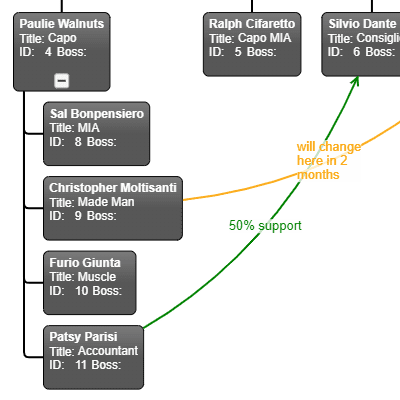
Org Chart Extras
Shows an org chart with extra links and expand/collapse functionality.
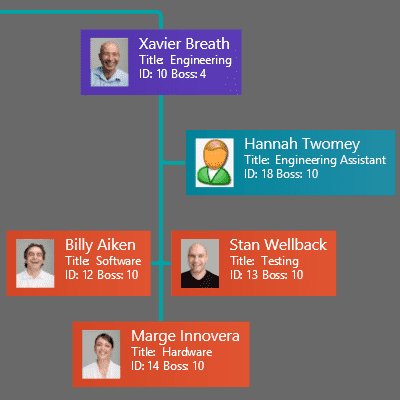
Org Chart Assistants
Shows an org chart with assistant nodes at the side, above regular child nodes.
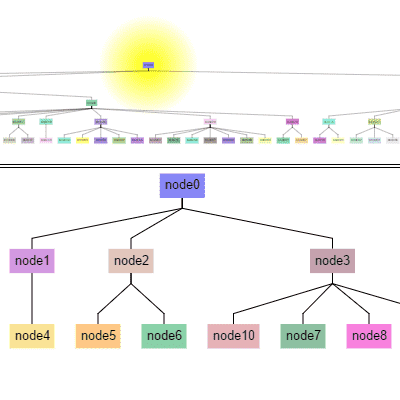
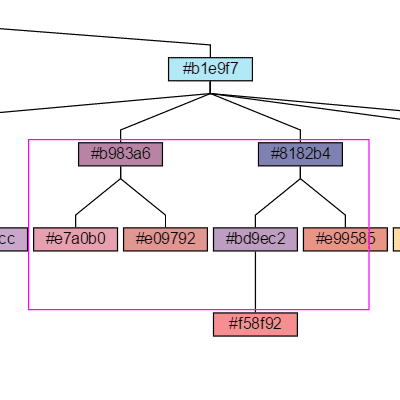
Local View
Two diagrams, the one on top showing a full tree and the one below focusing on a specific node in the tree and those nodes that are logically "near" it.
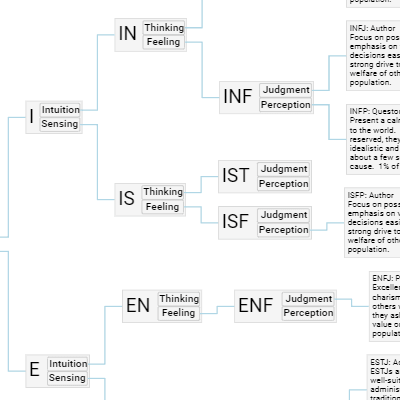
Decision Tree
Allows a user to make progressive decisions.
Incremental Tree
Demonstrates the expansion of a tree where nodes are only created "on-demand", when the user clicks on the "expand" Button.
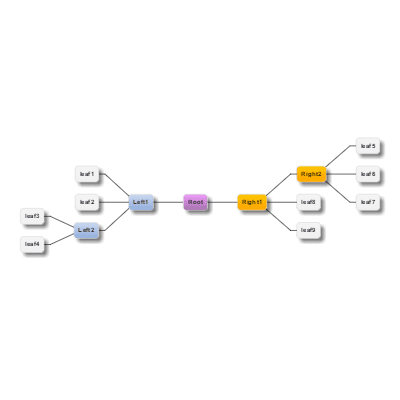
Double Tree
Displays a single diagram of two trees sharing a single root node growing in opposite directions, using the DoubleTreeLayout extension.
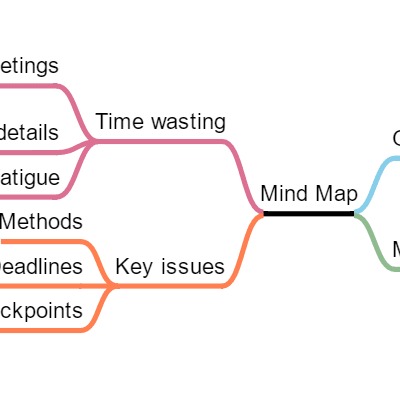
Mind Map
A Mind Map, a double-tree whose nodes have an "add" button when selected and a context menu.
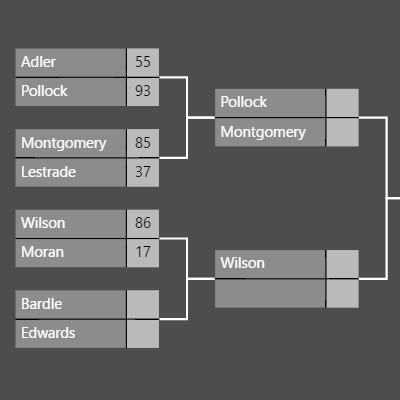
Tournament
Tournament bracket with dynamic advancement as scores are entered.
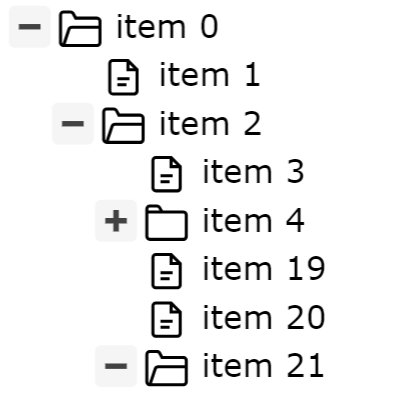
Tree View
Demonstrates a traditional "Tree View" in a GoDiagram diagram, with optional orthogonal links between the nodes.
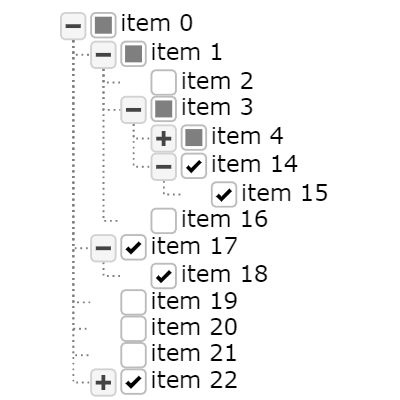
Tri-state CheckBox Tree
Demonstrates a traditional "Tree View" in a GoDiagram diagram, where each item has a checkbox with three states.
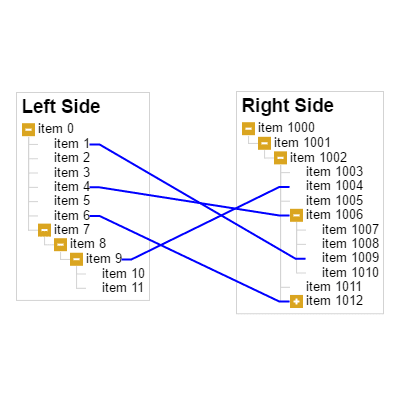
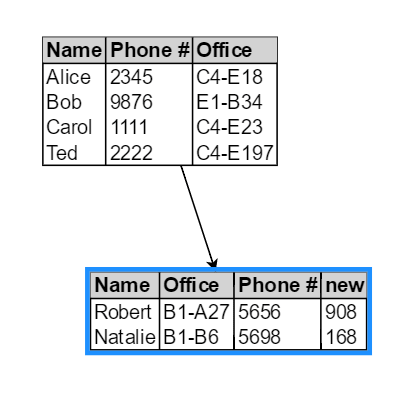
Tree Mapper
Displays two trees, allowing the user to dynamically draw or reconnect links mapping one tree node to another.
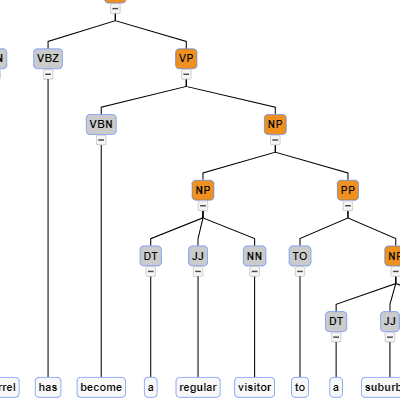
Parse Tree
A Parse tree representing the syntactic structure of a sentence. The leaf nodes are shown in a horizontal line.
Pipe Tree
A tree layout with rectangular nodes at alternating angles and no links.
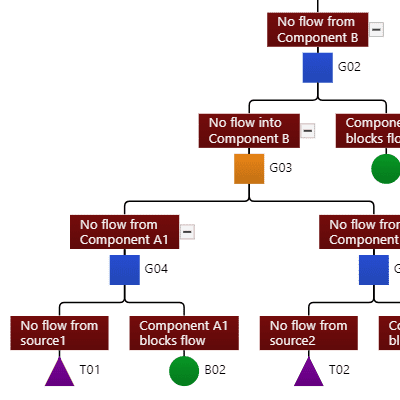
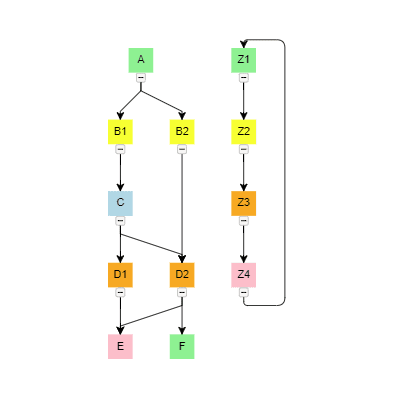
Fault Tree
A fault tree diagram with collapsing/expanding subtrees and gates at each non-root node.
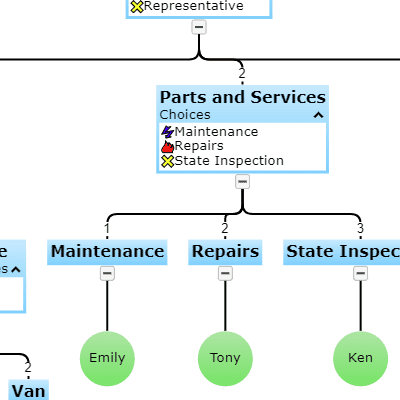
IVR Tree
Diagram representation of an Interactive Voice Response Tree (IVR tree). Nodes may have a collapsible list of details.
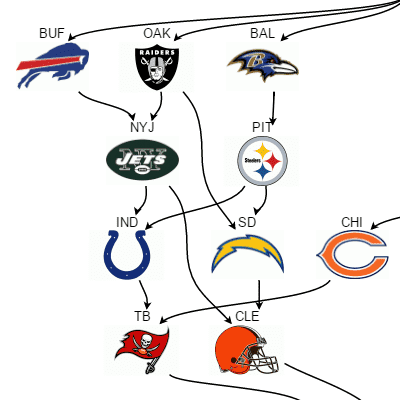
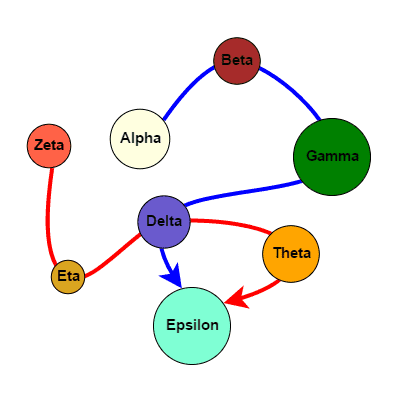
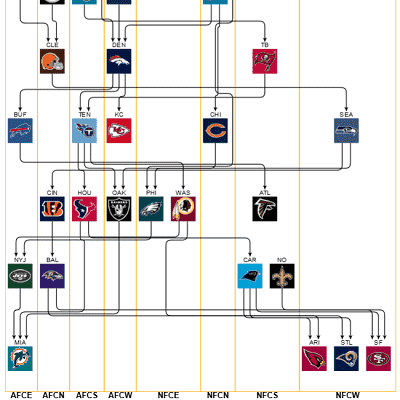
Beat Paths
Demonstrates reading JSON data describing the relative rankings of NFL teams at a particular moment in time and generating a diagram from that data.
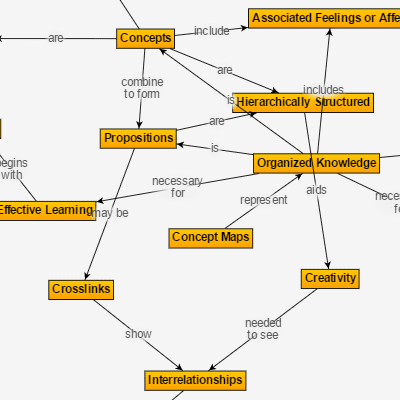
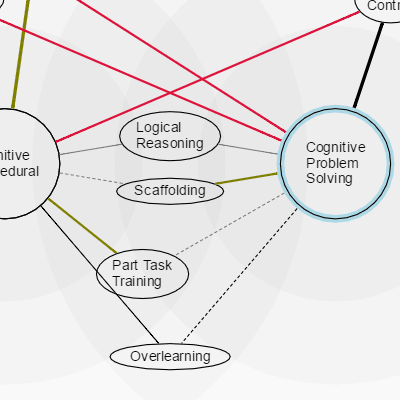
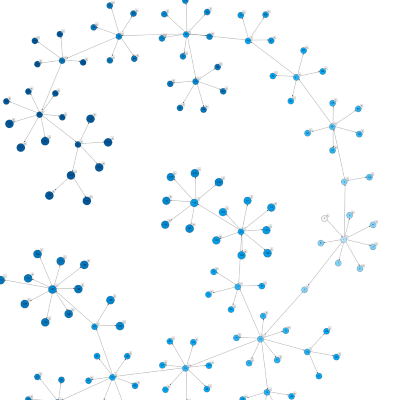
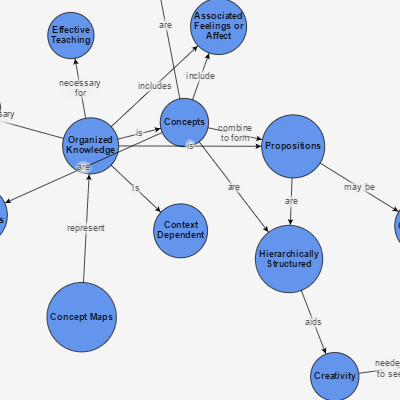
Concept Map
A web of interlinked concepts displayed with a ForceDirected Layout, showcasing link labels.
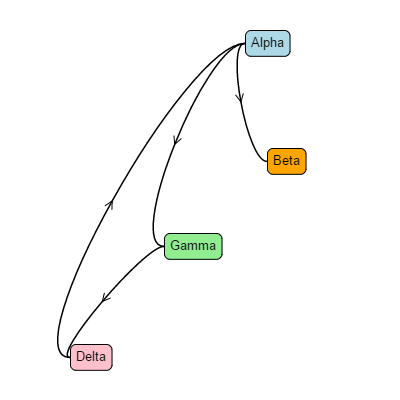
Distances & Paths
Show distances between two nodes and highlights one of all possible paths between the nodes.
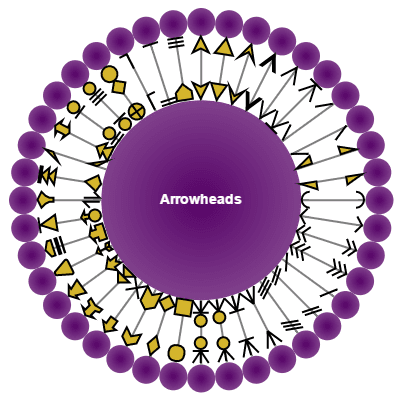
Arrowheads
Showcases all pre-defined Link arrowheads. You can define your own named arrowhead geometries.
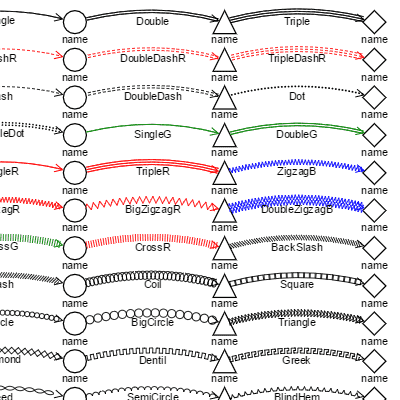
Relationships
Shows how you can create custom renderings for Links by repeatedly drawing GraphObjects along the route.
Link Curviness
An example customization of the Link.curviness property and having an arrowhead at the middle of the link route.
Multi-Node Path Links
Demonstrates custom routing for Links running through other Nodes.
Tapered Links
Demonstrates a custom Geometry for Link paths.
Multiple Arrowheads
A custom orthogonal Link that draws arrowheads at the end of each segment.
Draggable Link
Showcases draggable disconnectable links that can be connected by dropping one or both ends at a valid port.
Links to Links
Demonstrates the ability for a Link to appear to connect with another Link, using label nodes that belong to links.
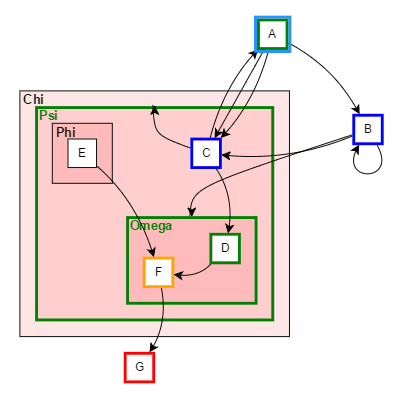
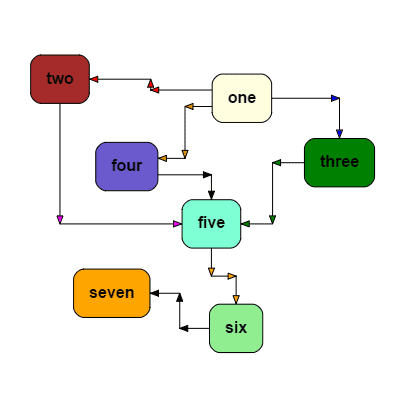
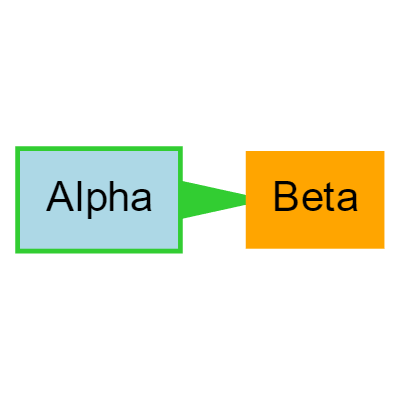
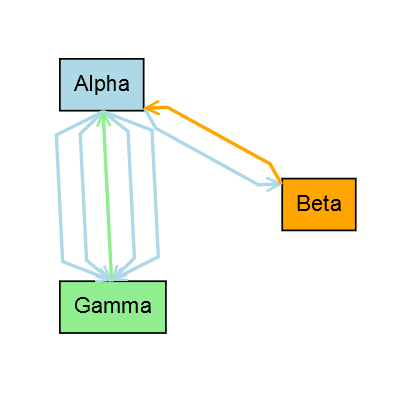
Navigation
Displays relationships between different parts of a diagram.
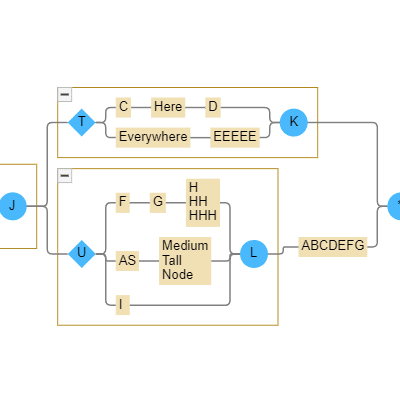
Grouping
Demonstrates subgraphs that are created only as groups are expanded.
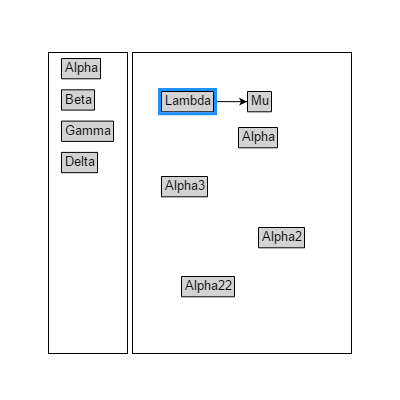
Regrouping
Allows the user to drag nodes, including groups, into and out of groups, both from the Palette as well as from within the Diagram.
Rounded Groups
BPMN Choreography that demonstrates subgraphs that have rounded headers and rounded footers.
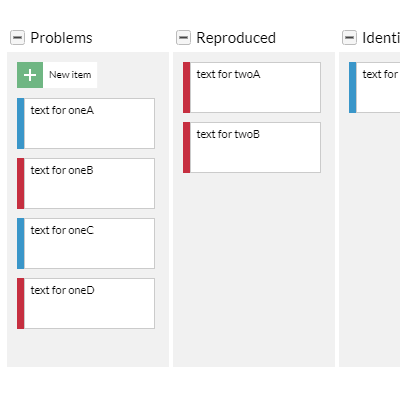
Kanban Board
A Kanban board editor, allowing the categorization of editable tasks.
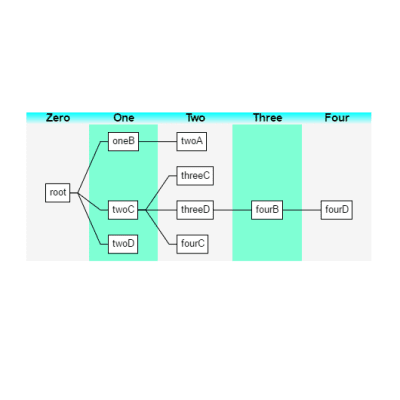
Layer Bands
Layer Bands are automatically created for each "layer" of a TreeLayout, and run perpendicular to the layout.
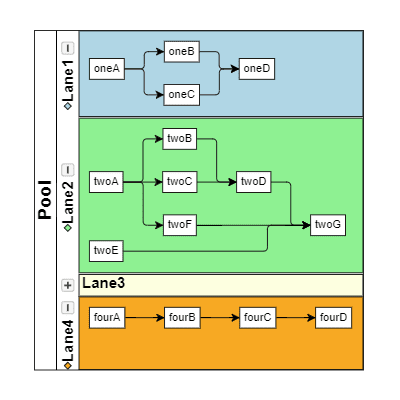
Swim Lanes
Demonstrates collapsible, resizable, re-orderable swimlanes, a kind of process-flow diagram, with custom dragging rules that disallow nodes from leaving their lane.
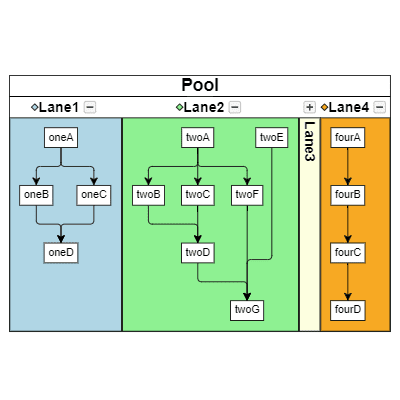
Swim Lanes Vertical
Demonstrates collapsible, resizable, re-orderable swimlanes, a kind of process-flow diagram, with custom dragging rules that disallow nodes from leaving their lane.
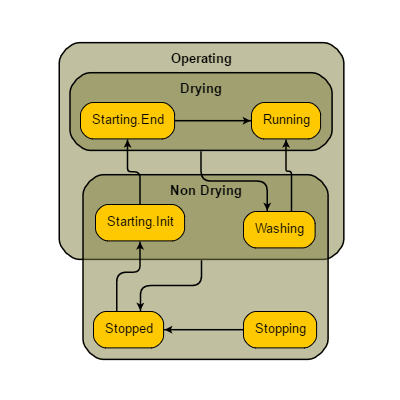
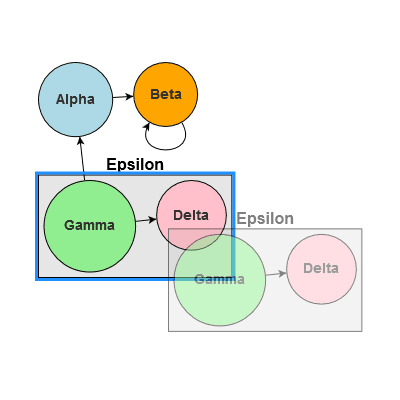
Shared States
As an alternative to using Groups, this manages Nodes that simultaneously belong to multiple containers.
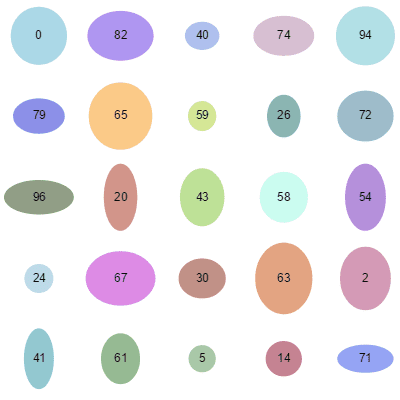
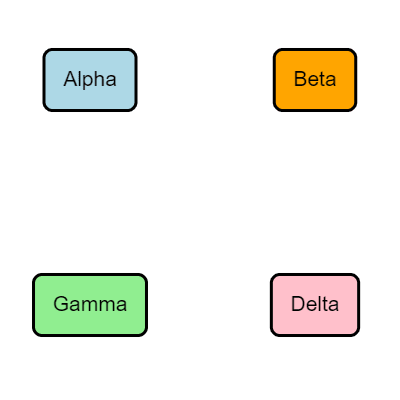
Grid Layout
Shows GridLayout and options. Places all of the Parts in a grid-like arrangement, ordered, spaced apart, and wrapping as needed.
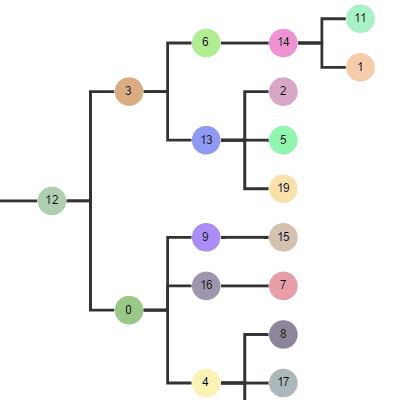
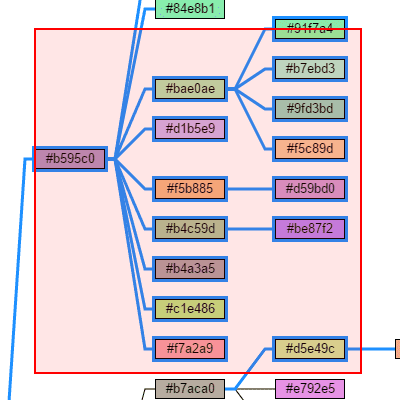
Tree Layout
Shows TreeLayout and options. Positions nodes of a tree-structured graph in layers (rows or columns).
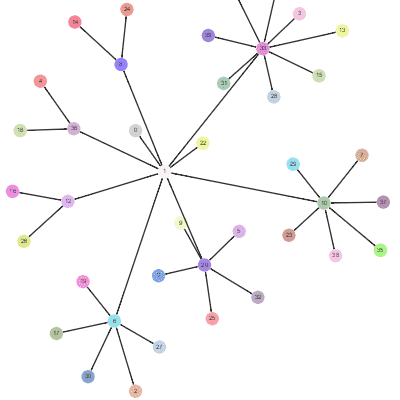
Force Directed
Shows ForceDirectedLayout and options. Treats the graph as if it were a system of physical bodies with forces acting on them and between them.
Layered Digraph
Shows LayeredDigraphLayout and options. Arranges nodes of directed graphs into layers (rows or columns).
Circular Layout
Shows CircularLayout and options. This layout positions nodes in a circular arrangement.
Interactive Force
A continuous ForceDirectedLayout that occurs as the user drags around a node.
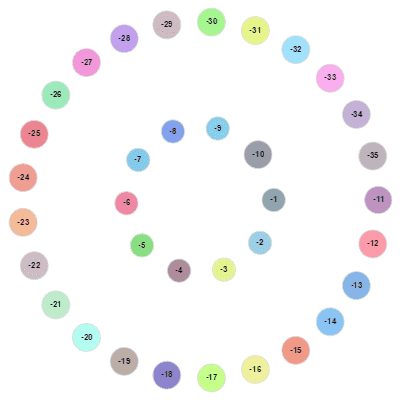
Double Circle
Multiple circles using repeated CircularLayouts.
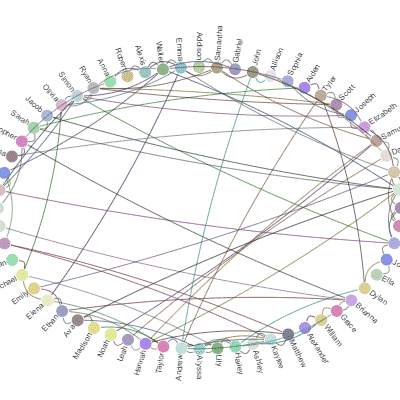
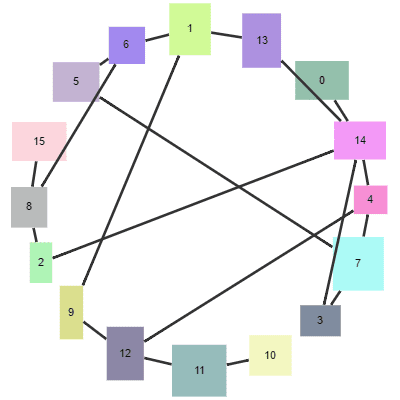
Friend Wheel
Demonstrates a customized CircularLayout.
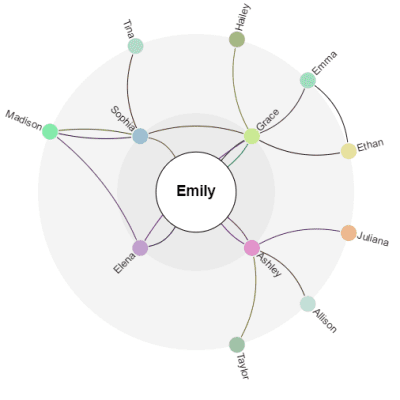
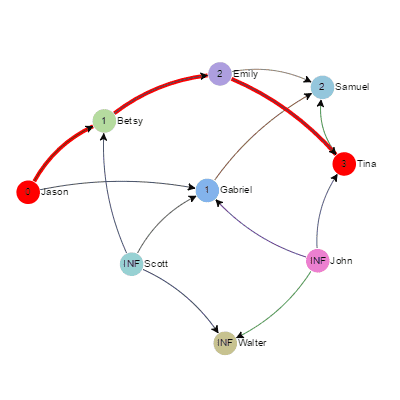
Recentering Radial
Arrange people in circles around a central person, in layers according to distance from the central person.
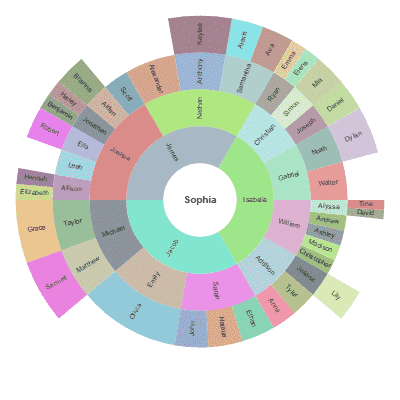
Radial Partition
Arrange people in rings around a central person, in layers according to distance from the central person.
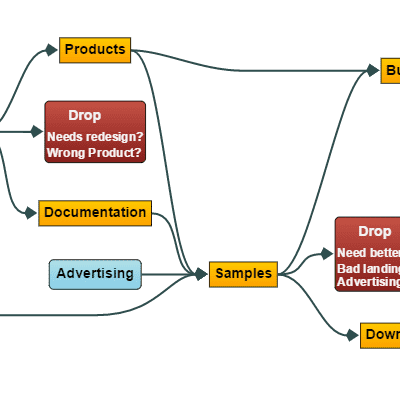
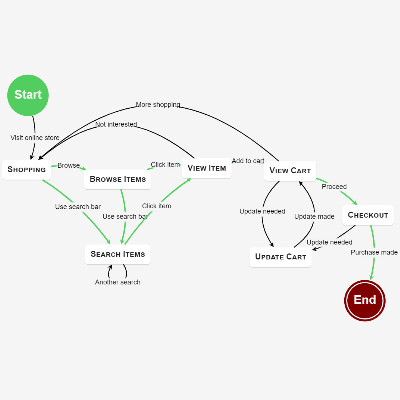
Page Flow
A diagram representation of webpage flow.
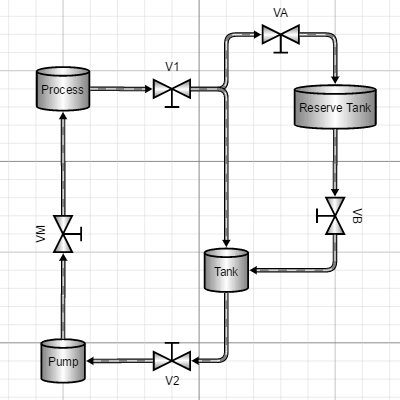
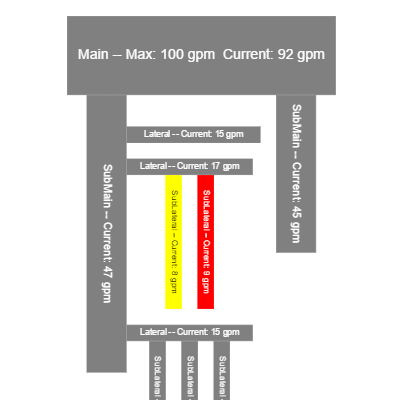
Process Flow
Tanks, valves, and pipes, with animated flow in the pipes.
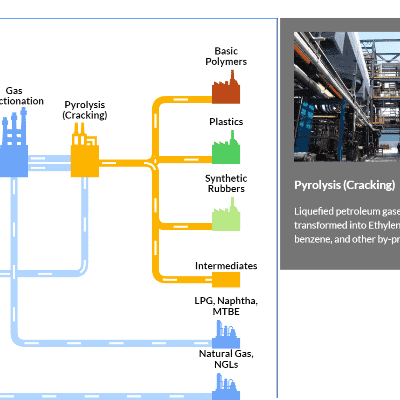
Production Process
Partially describes the production process for converting natural gas and oil byproducts into their end products.

Process Editor
A designer for creating production process diagrams.
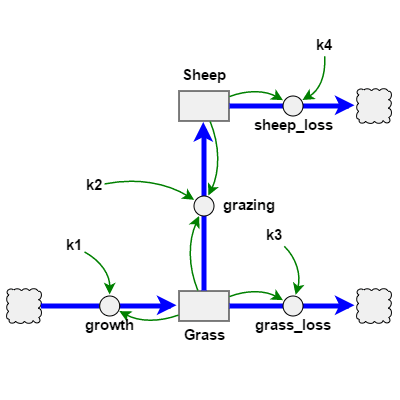
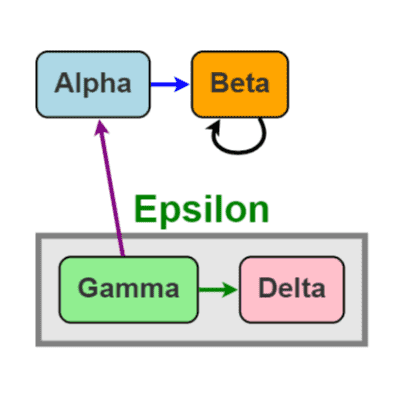
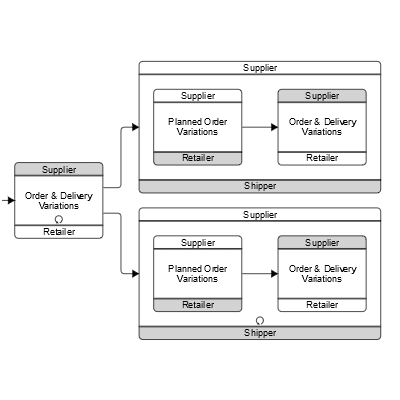
System Dynamics
A System Dynamics diagram shows the storages and flows of material in some system, and the factors that influence the rates of flow.
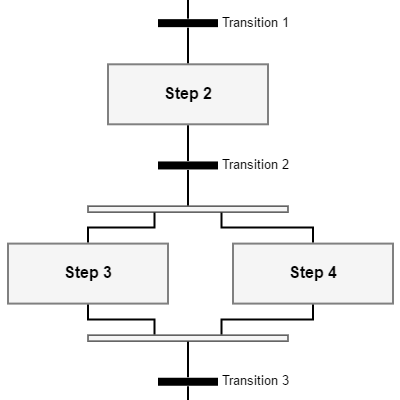
Sequential Function
A sequence diagram that shows different node templates, LayeredDigraphLayout and in-place text editing.
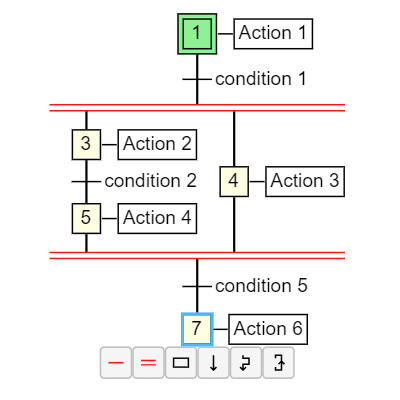
Grafcet Diagrams
A Grafcet is a kind of sequential function chart used in automation design.
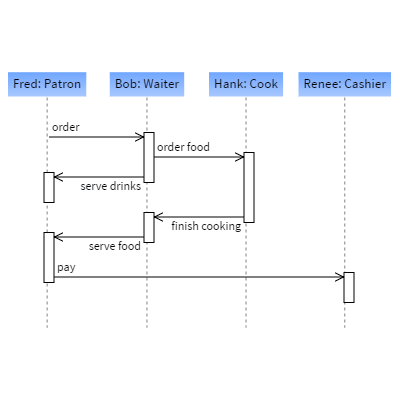
Sequence Diagram
A sequence diagram illustrates how different processes interact with one-another and in what order.
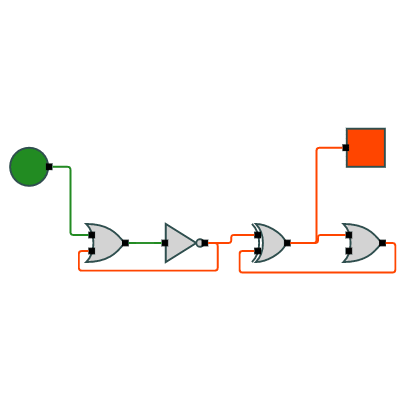
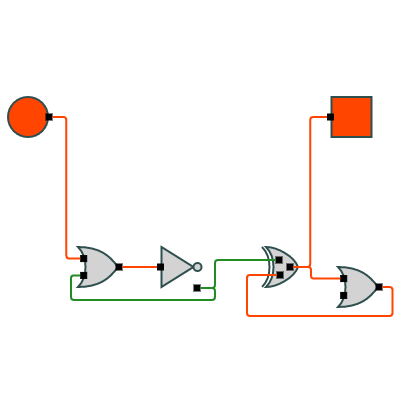
Logic Circuit
A functioning logic circuit diagram, which allows the user to make circuits using gates and wires.
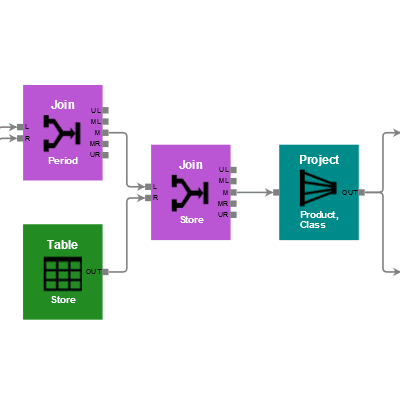
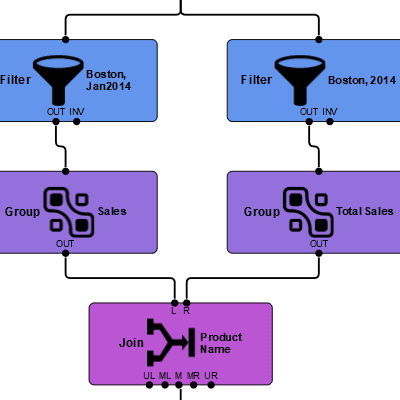
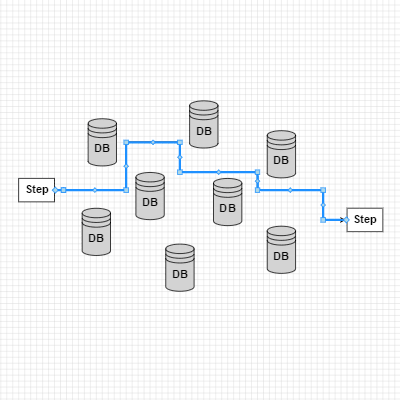
Data Flow
Show the processing steps involved in a database transformation or query, with labeled ports.
Data Flow Vertical
Same as Data Flow, but vertically oriented, and with slightly different styling.
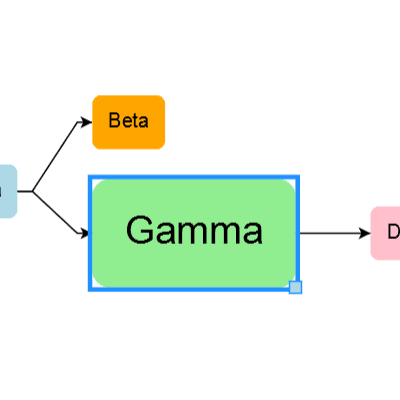
Dynamic Ports
Add ports to a selected node by clicking buttons or by using a context menu. Draw links by dragging between ports. If you select a link you can relink or reshape it.
Selectable Ports
A Node with ports that can be selected and deleted.
Draggable Ports
A Group with Nodes acting as ports that can be dragged within and between nodes.
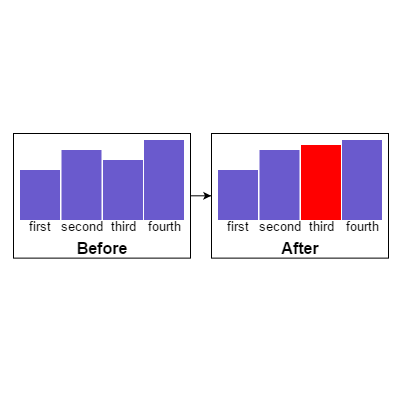
Bar Charts
Simple bar charts or histograms within nodes.
Pie Charts
Simple pie charts within nodes.
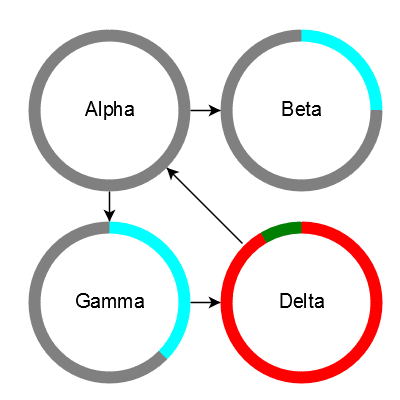
Donut Charts
Ring-shaped pie charts within nodes.
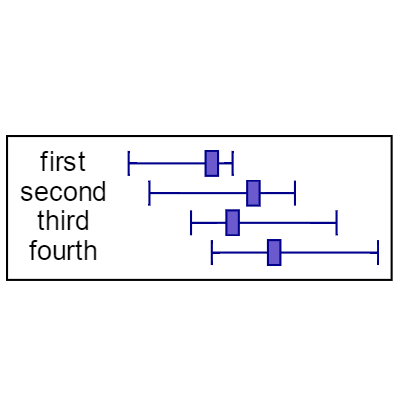
Candlestick Charts
Simple candlestick or range charts within nodes.
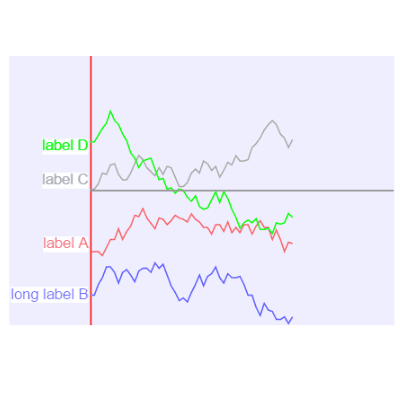
Sparkline Graphs
Simple sparkline charts within nodes.
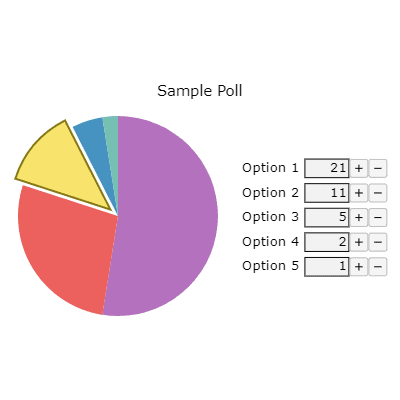
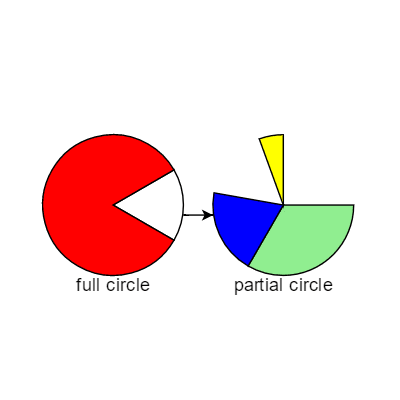
Dynamic Pie Chart
Dynamic pie chart with selectable slices that can change size.
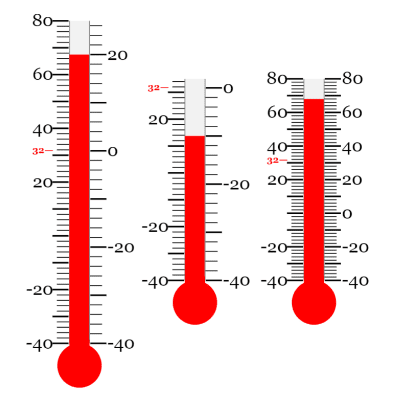
Thermometer
Graduated thermometer scales using Graduated Panel.
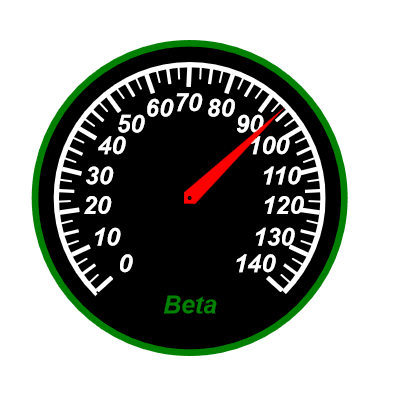
Instrument Gauge
A gauge using a scale made with a Graduated Panel.
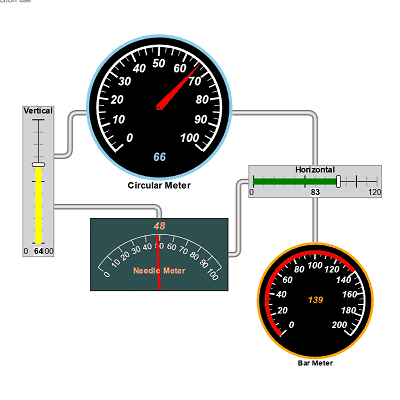
Meter and Gauge Controls
Various meters and gauges that show particular values and can be modified by the user by dragging.
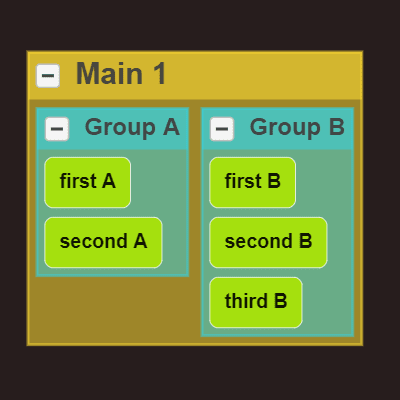
Content Alignment
Showcases alignment properties of the Diagram.
Custom Animations
Shows how to create several custom Node animations.
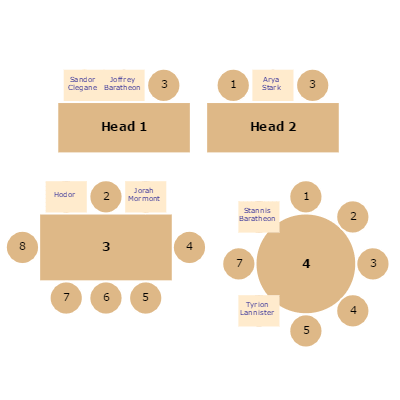
Seating Chart
This sample demonstrates custom logic in a GoDiagram diagram - a "Person" node can be dropped onto a "Table" node, causing the person to be assigned a position at the closest empty seat at that table.
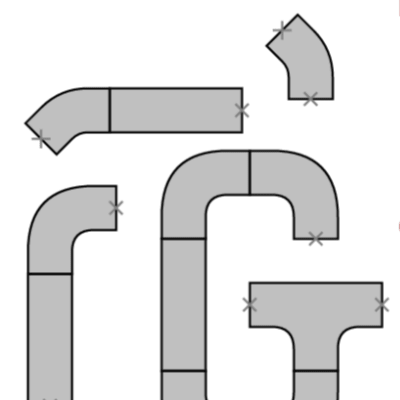
Pipes
Showcasing nodes (Pipes) that can be joined, and will snap and drag together.
Adornment Buttons
Selected nodes show a row of buttons that execute commands or start tools.
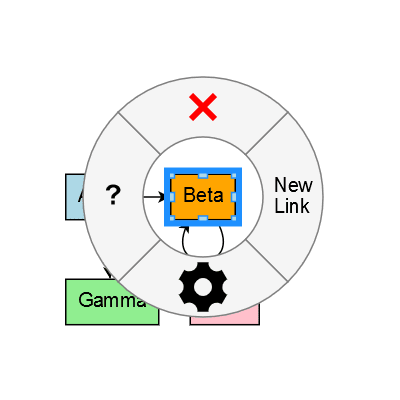
Radial Adornment Buttons
An adornment showing buttons in a circle on one selected node.
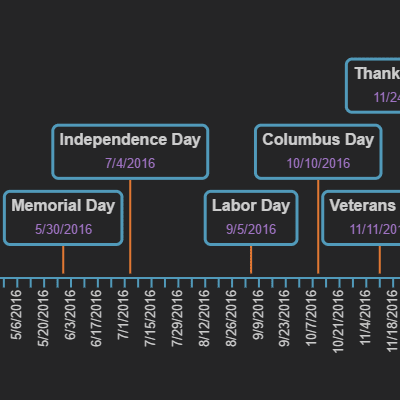
Timeline
A simple timeline with events arranged along a line.
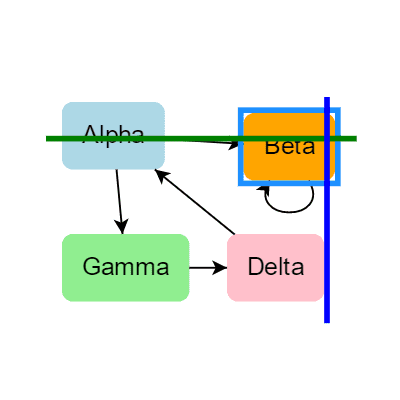
Rulered Diagram
A diagram with Graduated Panels at the edges acting as rulers.
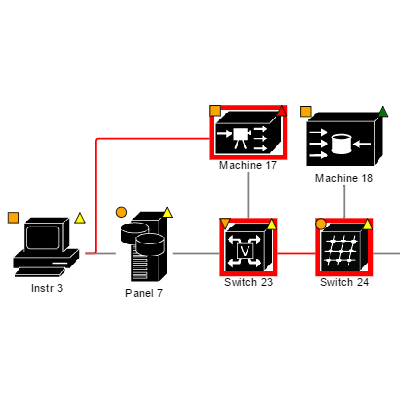
Shop Floor Monitor
Shows the continuously updating state of a number of stations on an imaginary shop floor.
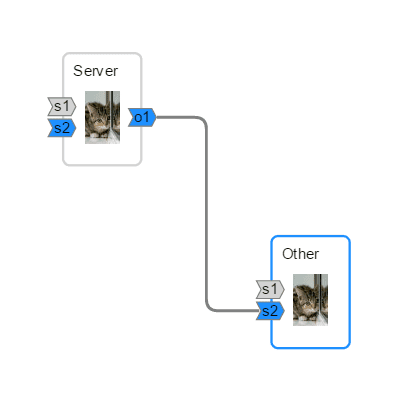
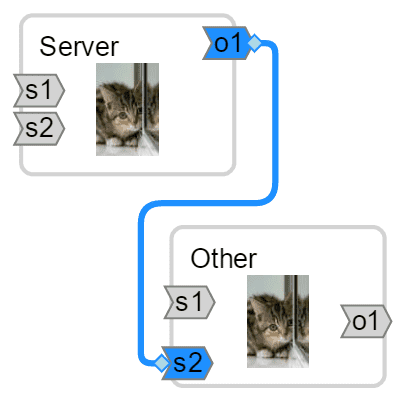
Kitten Monitor
A monitoring diagram where the nodes (kittens) move about a house, with tooltips for each kitten.
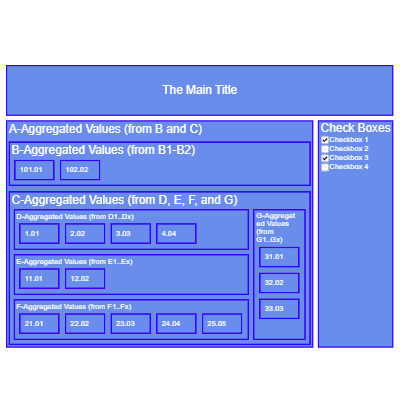
Spreadsheet
An example of nested Table Panels forming a spreadsheet-like grid.
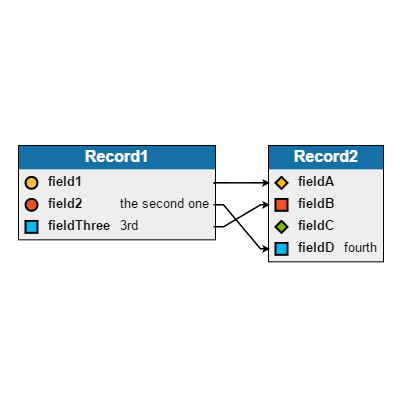
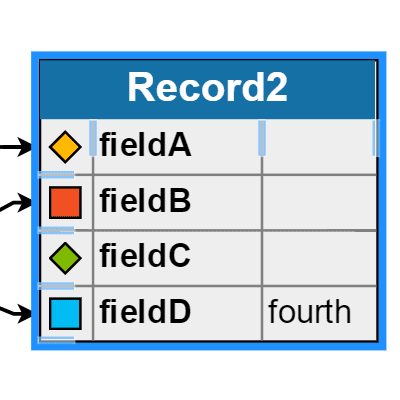
Record Mapper
Displays a variable number of fields for each record, with links mapping one field to another.
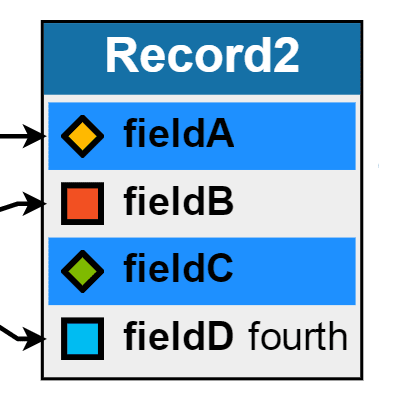
Selectable Fields
Records with fields that the user can select.
Add/Remove Table Columns
Demonstrates adding and removing columns of a Table Panel.
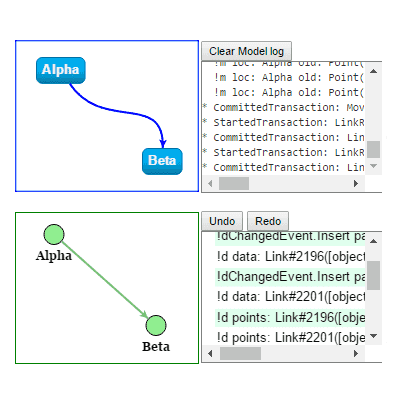
Update Demo
Showcases two Diagrams observing the same Model. Modifying positions in one Diagram will modify them in the model, updating the other Diagram as well.
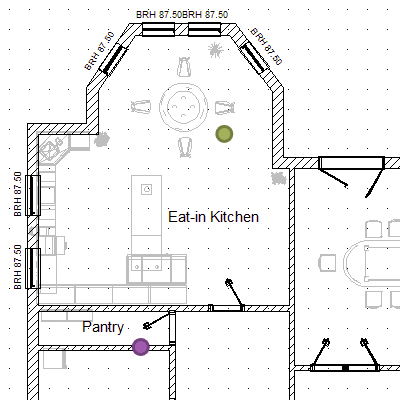
Single Page View
Show a diagram on a sheet of paper, limiting dragging and resizing to stay within the page minus margins.
Absolute Positioning
A diagram that does not scroll or zoom or allow parts to be dragged out of a fixed area.
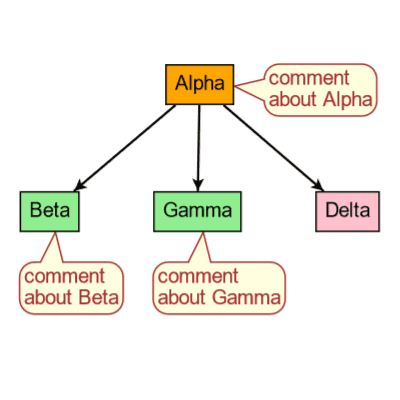
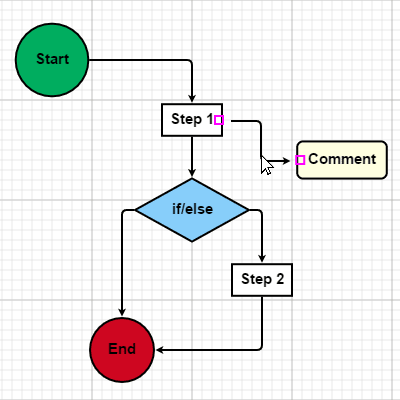
Comments
GoDiagram supports the notion of "Comments", including the ability to create balloon-like comments.
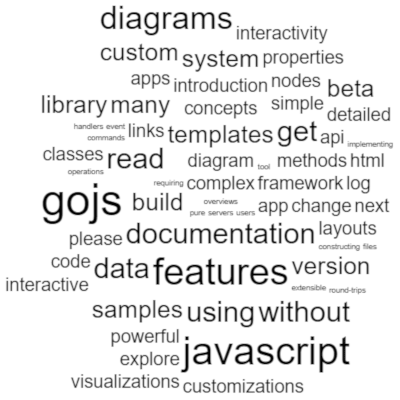
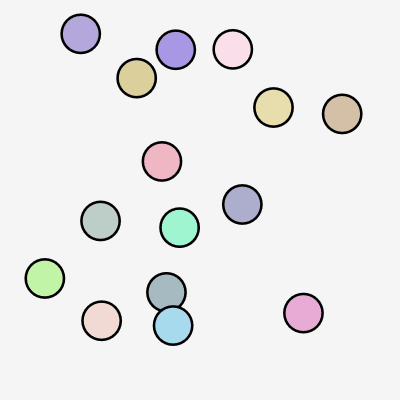
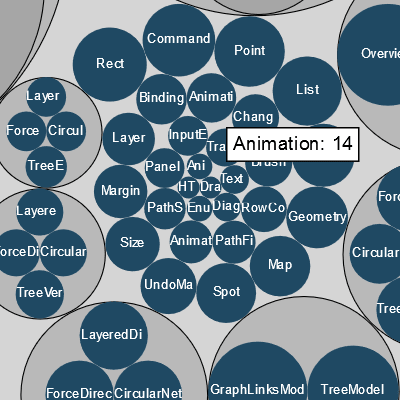
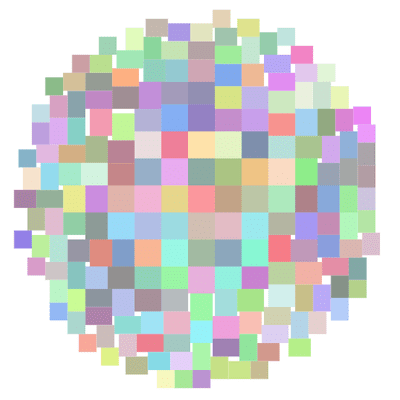
Word Cloud
A word cloud visualization using the PackedLayout extension.
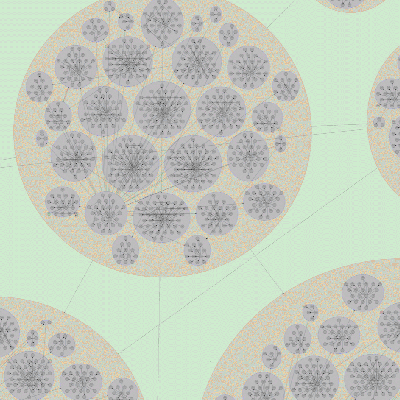
Packed Hierarchy
A customized PackedLayout that arranges nested circular groups.
Arranging Layout
The Arranging layout is a layout of layouts, plus a third layout for arranging left-overs.
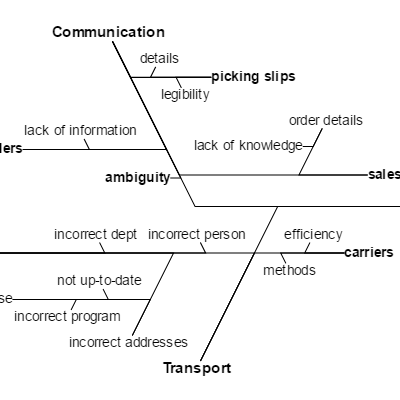
Fishbone Layout
The Fishbone or Ishikawa layout is a tree layout for cause-and-effect relationships.
Parallel Layout
A custom Layout that assumes there is a single 'split' and a single 'merge' node with parallel lines of nodes connecting them.
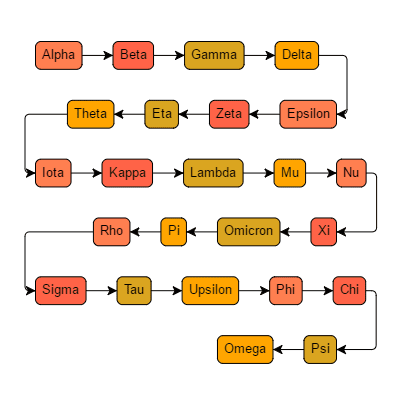
Serpentine Layout
A custom Layout that positions a chain of nodes in rows of alternating direction.
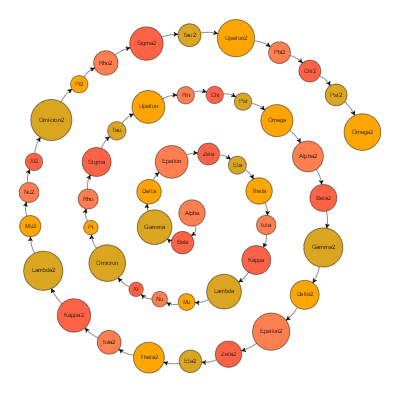
Spiral Layout
A custom Layout that positions a chain of nodes in a spiral.
Swim Lane Layout
A custom Layout that puts nodes into swimlanes with dependencies that cross lanes.
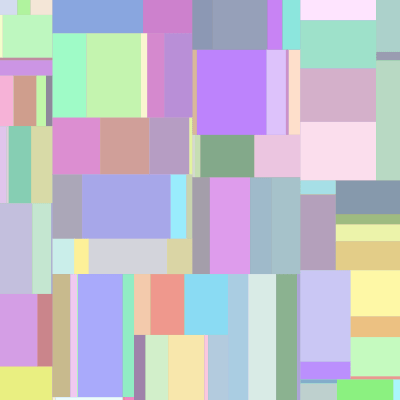
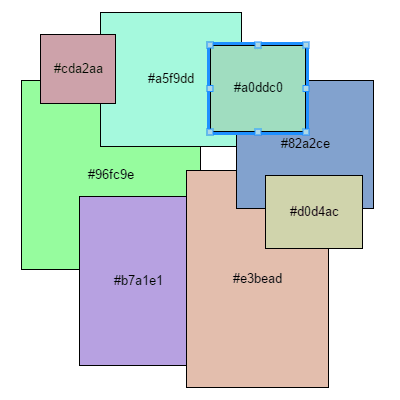
Tree Map Layout
A custom Layout that renders nested Groups into the viewport with each Node having an area proportional to its declared 'size'.
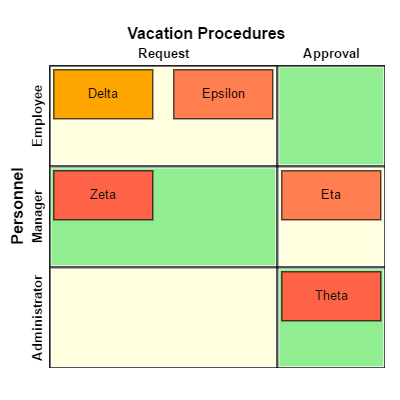
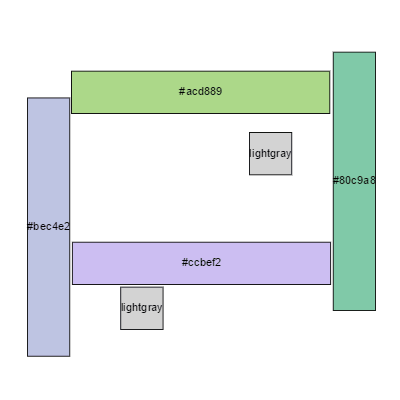
Table Layout
A custom Layout that arranges Nodes just as a Table Panel arranges GraphObjects.
Packed Layout
A custom Layout that positions nodes in a packed area.
Virtualized Packed Layout
A virtualized version of PackedLayout that positions nodes in a packed area.
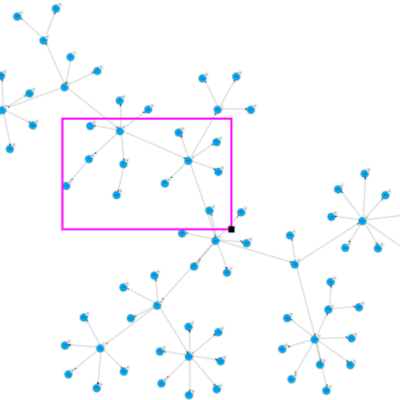
Realtime Drag Selecting
A custom Tool that lets a user drag and create a box to select nodes and links.
DragCreating
A custom Tool that lets a user draw a box showing where and how large a new node should be.
Drag Zooming
A custom Tool that lets a user draw a box showing what to zoom in to.
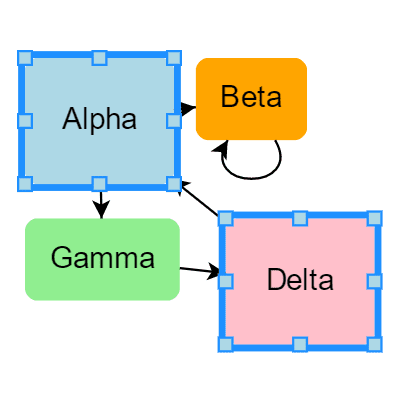
Resize Multiple
A custom ResizingTool that lets the user resize many selected objects at once.
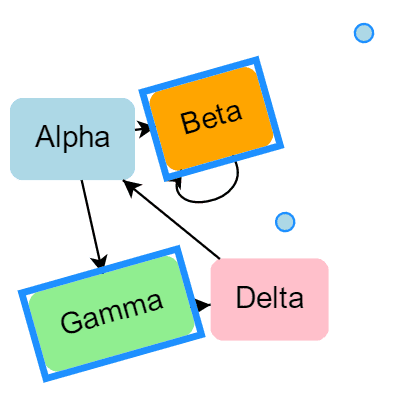
Rotate Multiple
A custom RotatingTool that lets the user rotate many selected objects at once.
Rescaling
A custom Tool that lets a user change the scale of an object.
Curved Link Reshaping
A custom Tool that lets the user reshape curved links with a single handle.
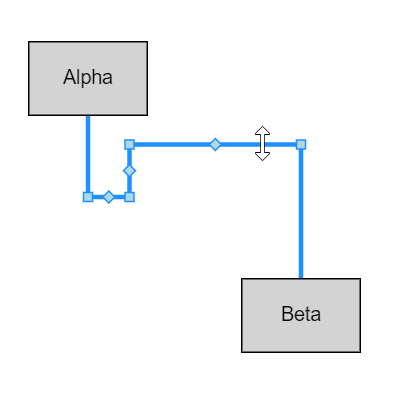
Orthogonal Link Reshaping
A custom Tool that lets the user reshape orthogonal links by dragging entire segments.
Overview Resizing
A custom Tool which allows the user to resize the overview box.
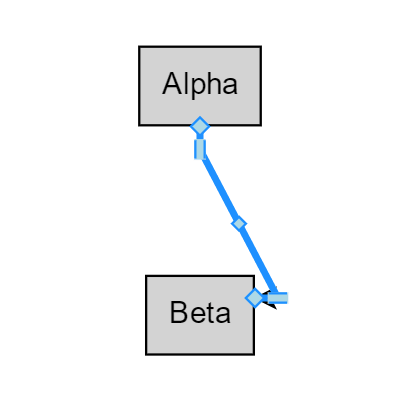
Snap Link Reshaping
A custom Tool that allows reshaping links with grid snapping.
Geometry Reshaping
A custom Tool that supports interactive reshaping of Geometries.
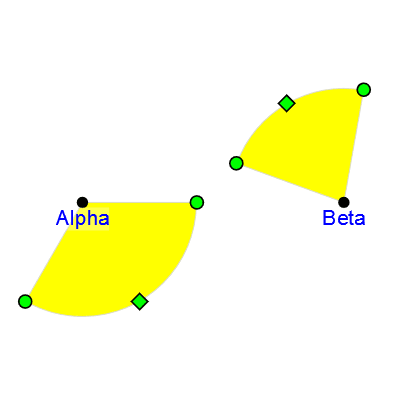
Sector Reshaping
A custom Tool that supports interactive reshaping of pie-shaped sectors of circles.
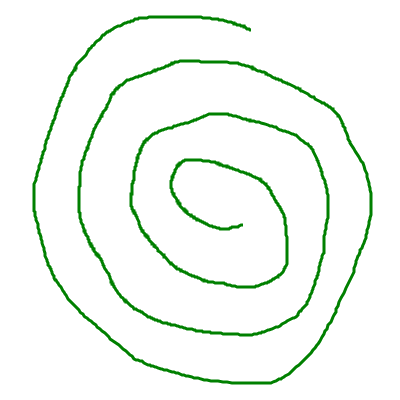
Freehand Drawing
A custom Tool that lets the user interactively draw a line, converting it into a Shape.
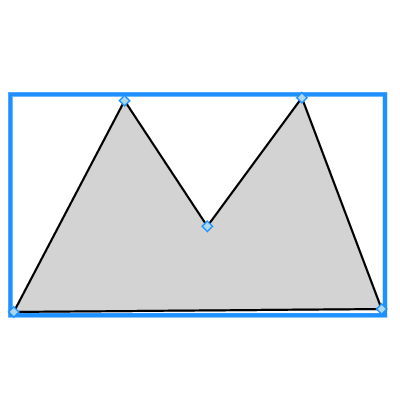
Polygon Drawing
A custom Tool that lets the user interactively draw polygons and polyline Shapes.
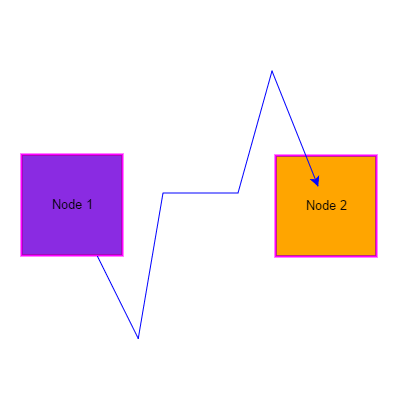
Polyline Linking
A custom LinkingTool that lets the user determine the route of a new Link by clicking.
Link Shifting
A custom Tool that adds handles on Links to allow the user to shift the end point of the Link along the sides of the port without disconnecting it.
Link Label Dragging
A custom Tool that lets the user drag a label on a Link and that keeps its relative position to the link.
Link Label On Path Dragging
A custom Tool that lets the user drag a label on a Link and that keeps the label along the path of the link.
Node Label Dragging
A custom Tool that lets the user drag a label in a Spot Panel of a Node.
Non Realtime Dragging
A custom DraggingTool that lets the user drag a translucent image of the Nodes and Links to be moved, leaving them in place until the mouse up.
Guided Dragging
A custom DraggingTool that makes guidelines visible as a Part is dragged around a Diagram and is nearly aligned with another Part.
Port Shifting
A custom Tool that lets the user drag a port in a Spot Panel of a Node.
Column Resizing
Two custom Tools that let the user resize the width of columns or the height of rows in a Table Panel of a Node.
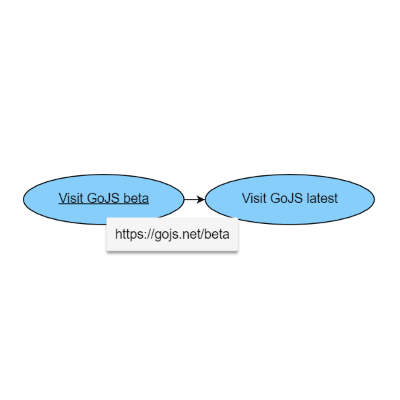
Hyperlinks
Demonstrates usage of the HyperlinkText extension.
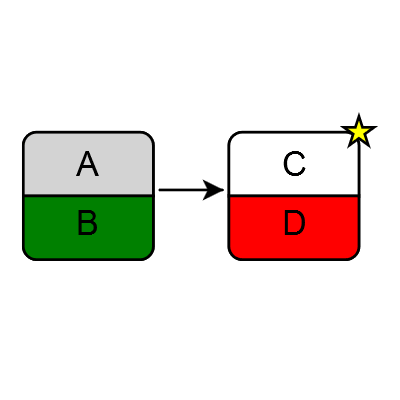
Two Halves
Demonstrates a Node with a top half and a bottom half, with rounded corners.
Balloon Links
Demonstrates custom Links that create a "Balloon" around the fromNode.
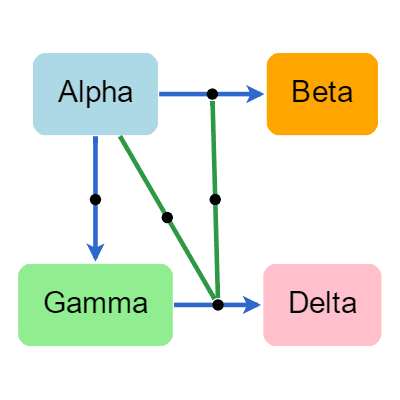
Parallel Route Links
Demonstrates custom Links that route parallel to other Links between the same two ports.
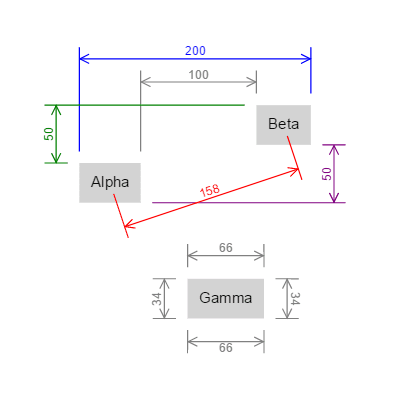
Dimensioning
Demonstrates custom Links that show the distance between two points.
Drawing Commands
Demonstrates custom CommandHandler which provides alignment commands and additional behaviors for the arrow keys.
Simulating Input
Demonstrates use of the Robot class to simulate mouse events.
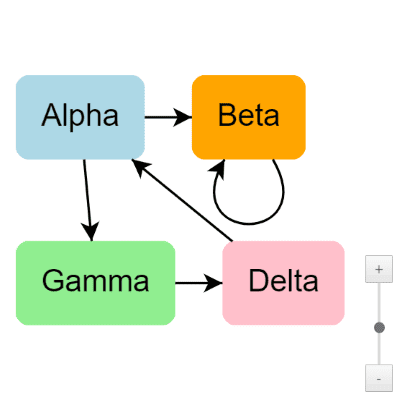
Zoom Slider
Demonstrates use of the ZoomSlider class to zoom in/out using a control.
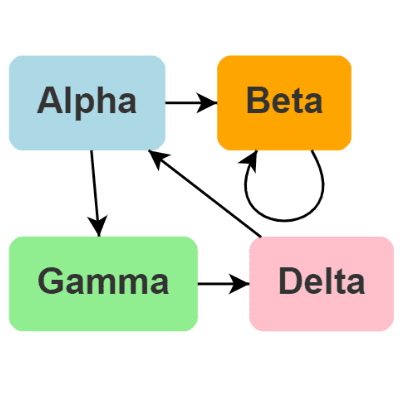
Minimal
Shows default Diagram interactivity and basic data binding. Select, move, copy, delete, undo, redo with keyboard or touch.
Spacing Zoom
When zooming, change the spacing of the Nodes, not the Diagram.scale.
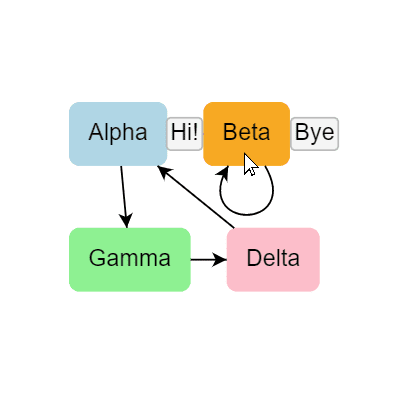
Hover Buttons
Shows buttons in an Adornment upon hover over a node.
Scroll Modes
Shows infinite scrolling and positionComputation.
Custom Expand and Collapse
Shows how to create Buttons with custom behavior for expanding/collapsing of a graph.
Constant Size
Kitten Monitor with constant size markers and tooltips when zooming out.
Virtualized
Virtualized no Layout, an example of virtualization where the model holds 123,456 node data yet the diagram only creates a few nodes at a time.
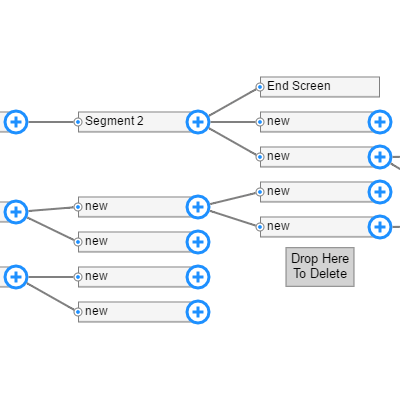
Flow Builder
Demonstrates a flow builder where nodes/links can be created or dropped onto a recycling node.
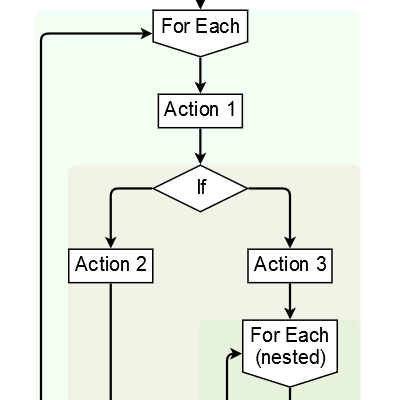
Flowgrammer
Demonstrates a flow-chart-like editor of a restricted syntax language. Uses the ParallelLayout extension.
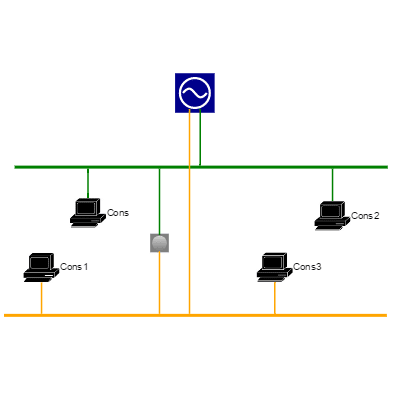
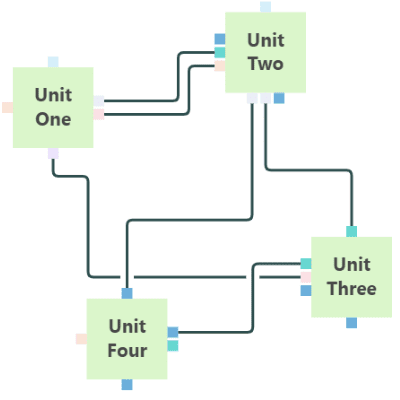
Network
Shows a network configurator with a Palette and Overview.
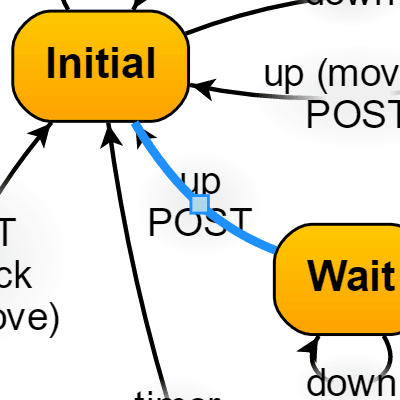
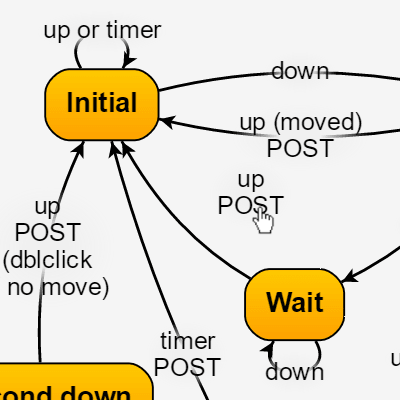
Incremental State Chart
State Chart using incremental JSON.
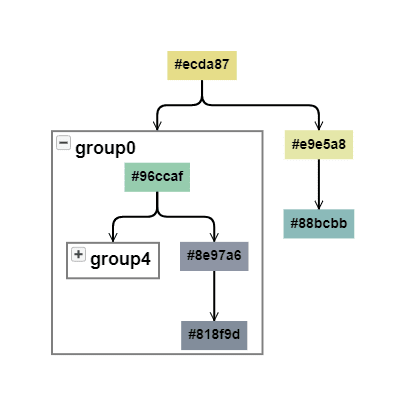
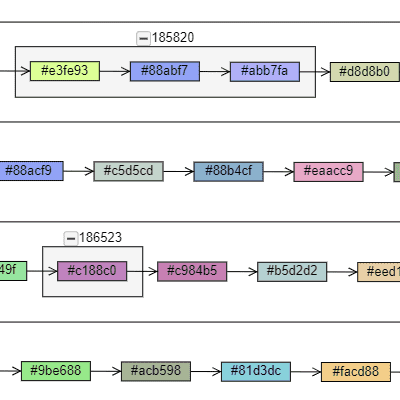
Regrouping Tree View
Regrouping with tree view of grouping hierarchy.
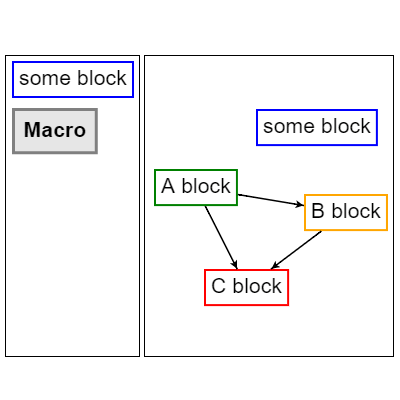
Macros
Demonstrates an automatic ungrouping of nodes when dropping an element on the diagram.
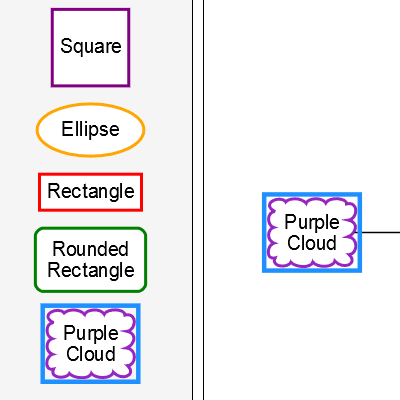
Adding Nodes to the Palette
Select and edit a node and add a copy of it to the palette.
Drag Unoccupied
Demonstrates a function to avoid any overlapping of nodes during dragging.
Panel Layout
Shows how to create a custom PaneLayout.
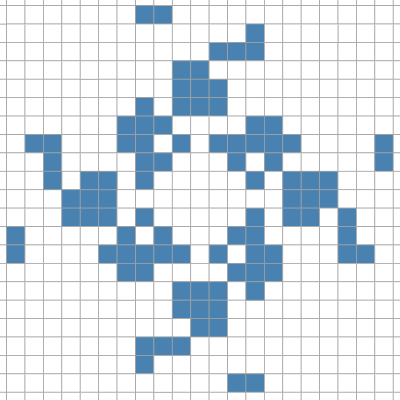
Game of Life
A cellular automation simulation.